Yield estimation by satellite data
One prominent application of remote sensing is monitoring the surfaces covered by vegetation, the biosphere itself, including both the
actual state and any changes on various timescales. Within the scope of this, both the estimation of the growing area of the main
agricultural species and the acquisition of basic data for yield estimation has considerable economic importance. Our group
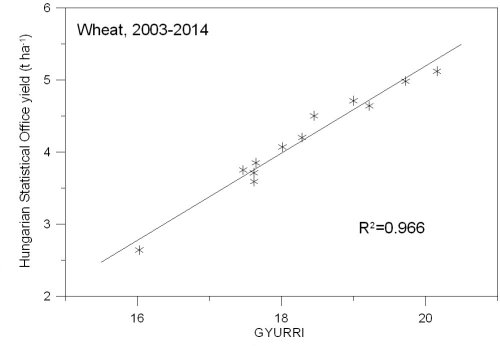
has developed a yield estimation method for the main hungarian crops. A new index (GYURRI - General Yield Unification Robust Reference Index)
was evolved, which has a very good correlation withe the yield of the crops. The figure below shows the connection between
the GYURRI index and the yield of the winter wheat in Hungary in the period of 2003-2014.
Yield estimates are made shortly after the crop has been harvested,
whereas forecasts are performed several weeks before the entire crop has been harvested.
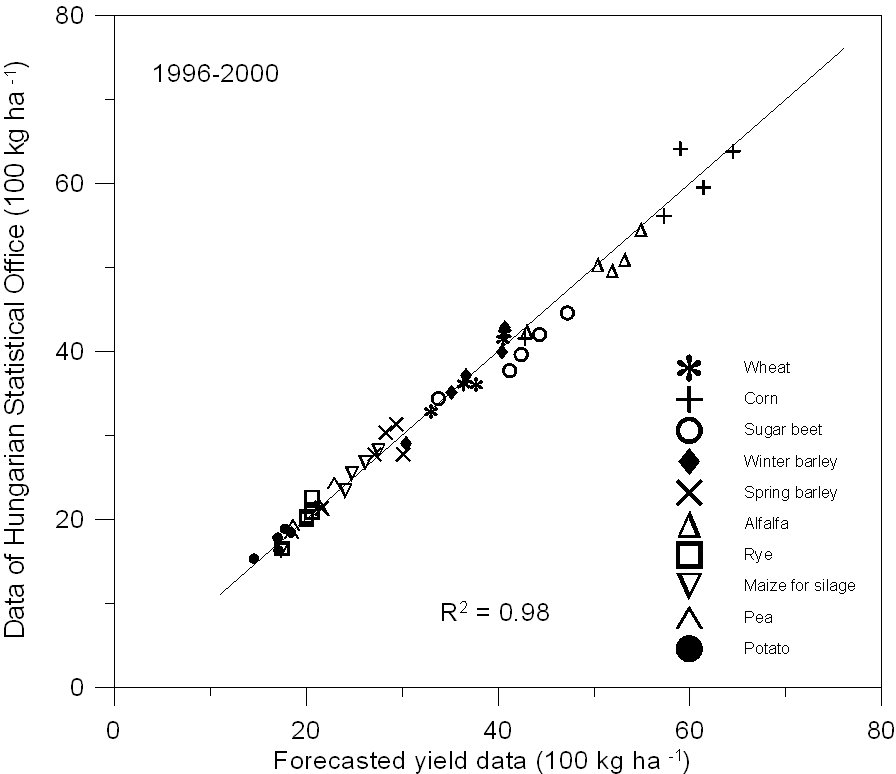
The figure below shows the forecasted and estimated yields of ten crops
(winter wheat, whinter barley, spring barley, maize, sugar beet, sunflower, maize for silage,
potatoes, alfalfa and peas) vs. the official yields in Hungary between 1996 and 2000.
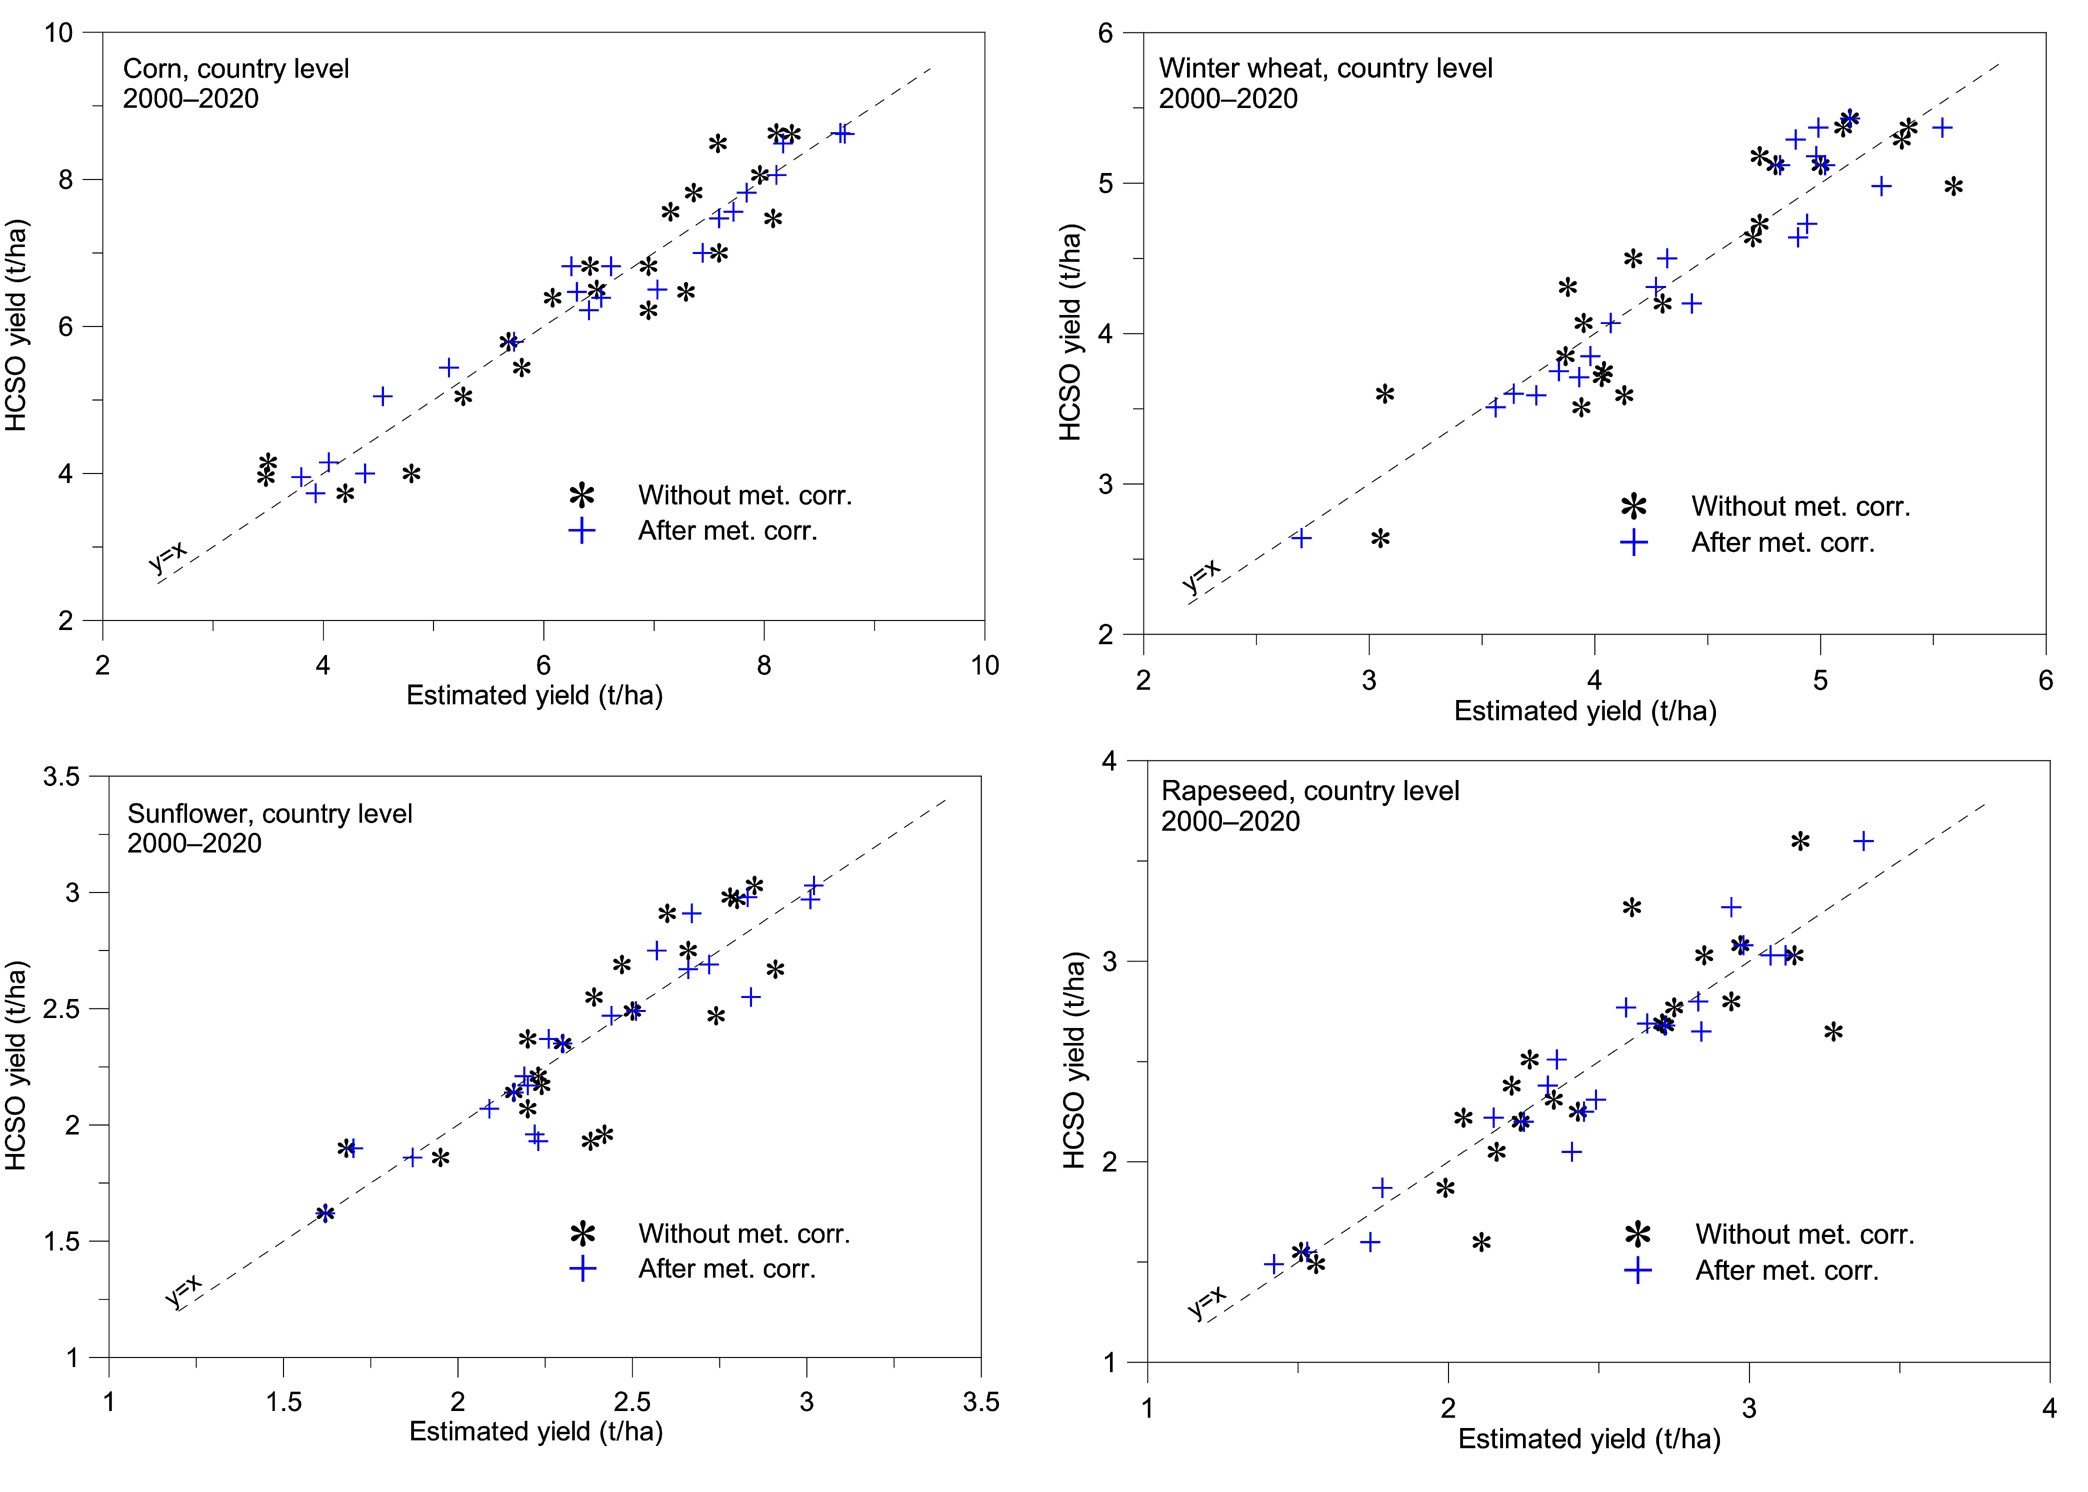
We tested our yield estimation method on a 21-year (2000-2020) MODIS data set. .
In the process, we examined the 4 plants with the largest sown area in Hungary (wheat, maize, sunflower, rapeseed)
at 9 cloud cover thresholds, applying 5 different curve fits to the measured points. 16 vegetation indices were
tested in the studies. The obtained results were corrected with meteorological (temperature, precipitation, radiation)
and soil moisture data averaged over different periods.
Click here for details.
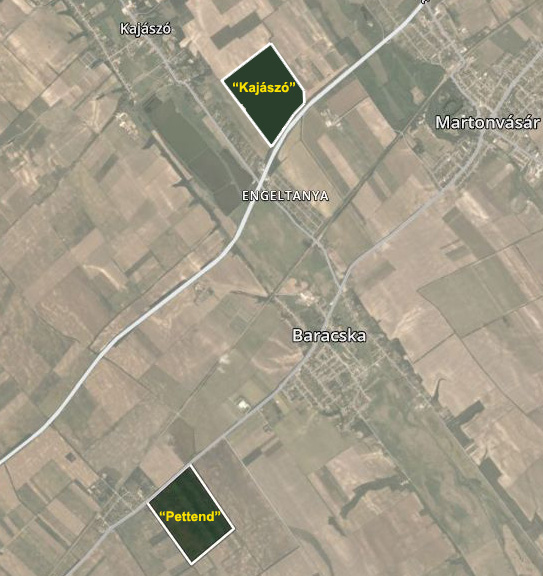
Using high-resolution PlanetScope data, we also conducted field-level yield estimation studies on two
fields near Martonvásár (Pettend, Kajászó), testing several vegetation indices. In the case of winter
wheat, the best results were obtained for the MCARI (R2=0.997) and GARI (R2=0.984) vegetation indices,
the former taking into account the reflectance values of the green channels in addition to the red and
near-infrared channels, while the latter also takes into account the reflectance values of the green
and blue channels. For the traditionally used NDVI, the correlation value was R2=0.973. For MCARI,
the difference between the estimated and actual yield data ranged between 0.1% and 1.3%.
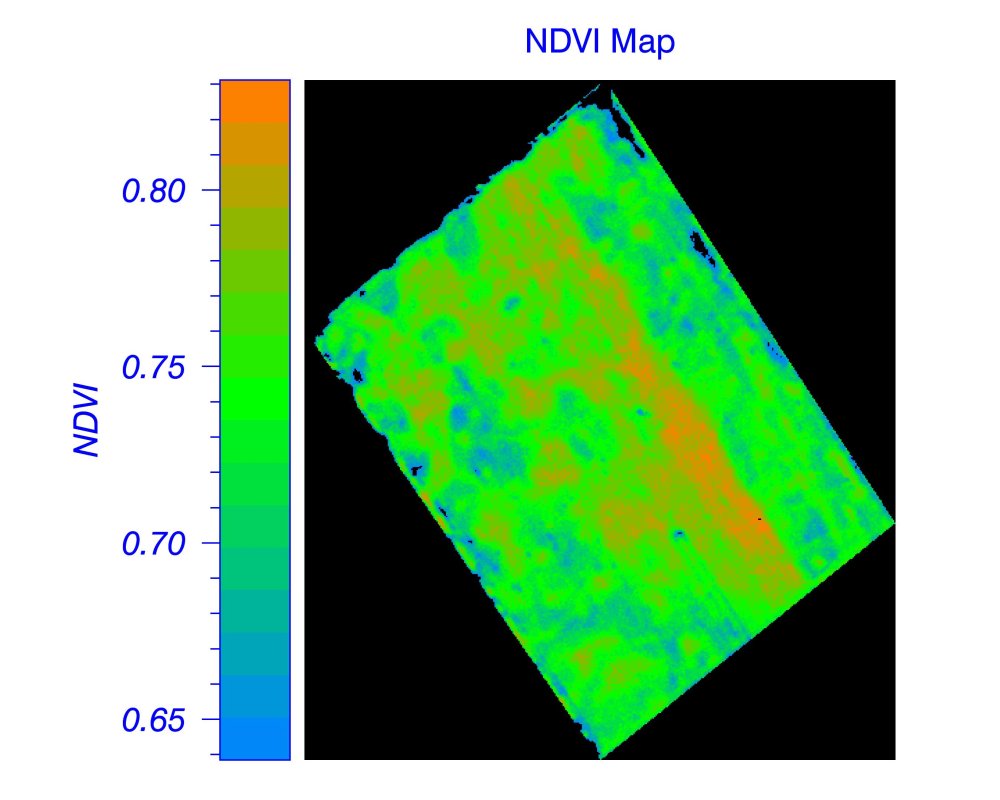
We also created NDVI maps for the two fields, which allow us to clearly follow the continuous changes
and identify positive (i.e., areas with higher than average NDVI values) and negative deviations.
These are only qualitative studies for now, but it can be stated that if in-field yield data are
available in the future - e.g. provided by a yield meter built into combines - then yield estimation
studies for precision agricultural purposes will also be possible.
| 
|
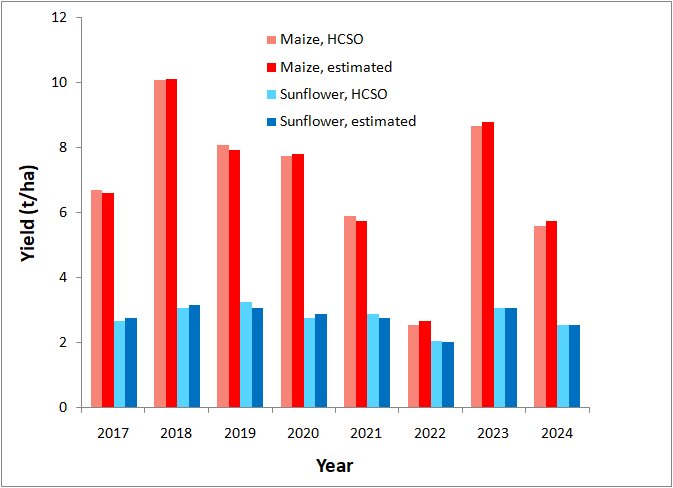
In our latest study, we applied the yield estimation procedure to HLS (Harmonized Landsat-Sentinel) satellite data from 2017 to 2024 for the Fejér County. We examined two crops, maize and wheat. In the case of maize, the average error of our estimate was 2%, and in the case of sunflower, it was 2.7%. Moreover, our model worked well in both cases even in the extremely drought year of 2022.