Space Research Group, Dept. of Geophysics, Eötvös Loránd University
H-1117 Budapest, Pázmány Péter sétány 1/a, Hungary.
E-mail: timar@ludens.elte.hu
Abstract: The geodetic datum and map projection parameters of the second military survey sheets (1821-1869) are described, along with the sheeting system to support the GIS integratiön of these maps without seeking for numerous ground control points. These parameters are valid in the present territory of Slovakia, Hungary, Burgenland, Podkarpatska Rus, and some parts of Romania and Serbia, too but are different from the ones valid in the Czech Republic and the most parts of Austria. The error sources of the fitting process are listed. In addition, a complete algorithm is proposed to make the fit of these map sheets to modern map grid systems, using GIS.
Key words: second military survey, Habsburg Empire maps, historical maps, geodetic datum, map projection, Slovakia, Hungary, Central Europe.
Introduction
The detailed, 1:28800 scale, maps of the second military survey of the Habsburg Empire are the first ones that show the whole territory of Slovakia and Hungary, using any map projection. Although Strenk (1985) suggests that the structure of the sheets of the first (Josephian) survey are identical with the Cassini projection, the literature handles it as a projectionless map system (Bod, 1982; Miklošík, 1997; Klein, 2001). Strenk (1992), Jankó (2001) and Veverka & Čechurová (2003) suggest that the second (Franziscan) survey has can be characterized by the Cassini projection. As the projecting process of the second survey is not precisely the Cassini one, in the Hungarian literature it is often referred to as also ’projectionless’ (Varga, 2002), although it significantly differs from the Josephian survey.
The development of the urban and environmental sciences often forms the claim to reproject the older maps in order to fit their content to the modern ones in common projection systems. As a result of this kind of map processing, the ancient status of the study area can be analyzed in georeferred form. Being the first projected map system covering the whole countries, the sheets of the Franziscan survey offer the best opportunity for this task. In the GIS practice, the need of fitting old maps to new ones – using ground control points, or any other methods – becomes quite frequent.
Using ground control points (GCPs), the task needs no detailed cartographic or geodetic knowledge but the low density or the lack of the acceptable GCP poses a real difficulty. It is obvious that just a few and/or uncertain GCPs result higher error of the fitting, and according to previous studies (Timár & Molnár, 2003) this error can reach even the 200 meters in case of the second survey sheets.
Veverka & Čechurová (2003) suggest a solution to fit the sheets of the second and third survey automatically, using the map corner points only. Their solution is valid for the Czech and Moravian territories only. As the historical Hungary (containing the present territory both of Slovakia and Hungary) had different geodetic systems than the Austrian and Czech regions, it is necessary to solve the same problem independently to these countries. In the present work, I give all the geodetic and projection parameters, along with some ancilliary procedures that are needed to integrate the map sheets of the second survey.
Fig. 1 The map sheet system of the second military survey of the Habsburg Empire, a map of Hofsätter (1989)
Obr. 1 Klad listov 2. vojenského mapovania Habsburgskej monarcie (podľa Hofsätter 1989)
Cartographic data of the second military survey
The description of the history of the mapping works of the second survey is beyond the scope of the present work – they are described well by Hofstätter (1989), Strenk (1992), Miklošík (1997), Jankó (2001) and Veverka & Čechurová (2003). Here I give such characteristics of the map system that are needed in the projection calculations. They are the data of the sheet system and the projection center(s).
In the framework of the map system making, sheet series with different scales. The scale of the survey sheets is 1:28800, the – less resolution – ’detailed’ maps (Spezialkarte) are in 1:144000. Two more, smaller scale series have been completed but here they’re not dealed with. The detailed maps contain a terrain piece of 3 * 3, therefore 9 survey sheets. Georeference can be found only on the detailed (1:144000) maps. The geographic coordinate system is indicated on the map frame with arc minute resolution, the prime meridian is Ferro (for the difference between Ferro and Greenwich there are several published data, in the present work it is set as 17° 39’ 46” in case of the second, and 17° 39’ 46.02” in case of the third survey). The interpretation of the geographic coordinates are discussed later in the next chapter. On the survey sheets there are nor geographic neither projected coordinates indicated.
In the territory of the Habsburg Empire – according to the distortion of the applied projection, increasing farther from the central meridian – several projection centers and central meridians have been selected. In case of the present territories of Slovakia and Hungary, the higher (southern) tower of the Vienese Stephansdom was the projection center. It can be noted that the maps of Vorarlberg, Tirol, Salzburg, Nieder- and Oberösterreich and the Moravian territories have the same projection center but the sheeting system is different (Jankó, 2001; Veverka & Čechurová, 2003). The coordinates of the Stephansdom on the local datum (described in the next chapter) are Φ=48º 12’ 34”; ΛF=34º 02’ 15” (from Ferro), so ΛG=16º 22’ 29” (from Greenwich) by Mugnier (1999) and are slightly different: Φ=48º 12’ 32.75”; ΛF=34º 02’ 21.60” by Veverka & Čechurová (2003). Of these two possibilities, according to the analysis of some Hungarian map sheets, the latter values proposed by Veverka & Čechurová (2003) are proved to be convenient for cartographic and GIS purposes.
The sheeting and numbering of the detailed (S=1:144000) maps are the followings: the columns are marked by letters, the rows by numbers and the projection center is the geometric center of the sheet ’C-5’ (Jankó, 2001). The letters from A to O are increasing from west to east, the row numbers increase from north to south. Note that there is no column ’J’, the column ’I’ is followed by column ’K’.
The survey (S=1:28800) sheets are also structured into rows (Sectio) and columns (Colonne). The projection center is the geometric center of the sheet in the row 44 and column 21. The columns are marked by Roman numbers, so the title of the referred sheet is ’Sectio 44 Colonne XXI’. The size of the sheets are similar to the ones of the first survey, on the terrain this is 9600 fathoms * 6400 fathoms, and on the maps 63.21 cm * 42.14 cm. As one Vienese fathom equals to 1.89648 meters, the terrain size is 18206.2 m * 12137.5 m. The terrain size of the lower scale detailed maps is 54618.6 m * 36412.5 m. Note that the map sheet and covered terrain sizes are different from the ones of the Czech and Moravian territories (Veverka & Čechurová, 2003).
It has to be noticed that on the copies of the survey sheets in the Map Archive of Military History, Budapest, the left and bottom framelines are uncertain, perhaps due to the previous foldings. Therefore, in the automatic or semi-automatic fitting procedures, only the north-eastern (upper right) frame corner can be used as a reference point.
As it was mentioned above, the projection of the maps can be considered as the Cassini one. If we accept this concept, the central meridian of the projection follows the vertical central line of the column XXI (or the column C on the detailed maps), and the sheet frame lines are the projection grid lines. However, Varga (2002) notices that the used projection is not precisely the Cassini one: in some cases, this causes significant distortions: maximum 200 meters in mountaneous, and maximum 60 meters in flatland area (Timár & Molnár, 2003).
The geodetic datum of the second survey
The second triangulation net of the Habsburg Empire has been completed by the cabinet order 1806 of Emperor Francis I. The triangulation works in the present territories of Slovakia and Hungary has started about 1821 and lasted till 1861 (Homoródi, 1953). It is still argued, which ellipsoid has been used, in the present work I accept the choice of Bod (1982) and Varga (2002), and assume that the Zach-Oriani hybrid ellipsoid has been used: its semimajor axis is a=6376130 meters after Zach, and its flattening is f=1/310, after Oriani.
For the transformation of the map sheets to modern projections, it is necessary to define not only the ellipsoid but also its spatial position, the so-called datum shift parameters. This datum is mentioned by Mugnier (1999) as ’Vienna Datum 1806’, following the assumed geodetic center and the date of the of the order of Francis I about to starting the triangulation net. Indeed, after 1821, in the present territories of Hungary and Slovakia, the center of the geodetic network was the eastern pillar of the observatory of Gellérthegy (Budapest; Homoródi, 1953). Therefore this datum is henceforth referred to as ’Buda-1821’ (Timár & Molnár, 2003). It is an interesting question that what problems can be caused that in case of Slovakia and Hungary, the map projection center is not interpreted on the sheets’ own map datum (Vienna, with Niederösterreich, had a different geodetic center). This causes a certain error that can be corrected by a simple manual shift of the reprojected maps that is detailed at the and of the paper.
Although the Gellérthegy observatory has been destroyed during the 1849 siege of Buda, its eastern pillar remained standing till 1867 so it was visible – and appropriate for orienting measures – during the full period of the geodetic works of the second survey. Later the point has been restored by a stone basepoint for later usage, and even nowadays it can be seen as a small monument in the Citadel of Gellérthegy. This point operates now as a third-order basepoint, its number is 65-4011.
The longitude of the Gellérthegy, derived from Vienna, was Λ0,F=36º 42’ 51.57” (from Ferro) so Λ0,G=19º 3’ 5.55” (from Greenwich), its latitude has been set after astronomic measurements to Φ0,G=47º 29’ 15.97” (Homoródi, 1953). As Homoródi (1953) lists several coordinates of the geodetic center, each ones after Marek (1875), an uncertainity of 25 meters occurs also in the derived datum shift parameters. In a short manual check of using the Buda sheet rectified by the method described at the end of the paper, the coordinates of the Gellérthegy point occured to Λmanual,G=19º 3’ 12.8” and Φmanual,G=47º 29’ 18.8”. In the following calculations, however, the data of Homoródi (1953), are used.
To estimate the datum shift parameters between the Buda-1821 and the WGS84 datums, the WGS84 coordinates of this Gellérthegy point have to be used. These coordinates have been calculated from the Hungarian national grid (EOV) coordinates of the point 65-4011. Using the EGM96 global geoid model (NIMA, 1997), the ellipsoidal height of the point has been also estimated. Thus, the geocentric coordinates of the Gellérthegy basepoint are (Timár & Molnár, 2003):
XWGS84,Gellérthegy =4081708 m;
YWGS84,Gellérthegy =1409227 m;
ZWGS84,Gellérthegy =4678717 m;
with an error less than 1.5 meters. Assuming that the ellipsoidal height above the Buda-1821 datum equals to the altitude above the (Adriatic) sea level, the geocentric coordinates of the Gellérthegy point, in line with the Buda-1821 datum are:
XBuda1821,Gellérthegy =4079944 m;
YBuda1821,Gellérthegy =1408944 m;
ZBuda1821,Gellérthegy =4678148 m;
with an error af about 25-30 meters, due to the ambiguity of the old coordinates (Marek, 1875), or even more, according to the mentioned manual check. The datum shift parameters can be estimated as the difference between the two datasets as follows (Timár & Molnár, 2003):
dXBuda-1821= XWGS84,Gellérthegy–XBuda-1821,Gellérthegy ≈ +1764 m;
dYBuda-1821= YWGS84,Gellérthegy–YBuda-1821,Gellérthegy ≈ +283 m;
dZBuda-1821= ZWGS84,Gellérthegy–ZBuda-1821,Gellérthegy ≈ +569 m.
Here a simple datum shift model is used; neglecting the orientation differences between the local and WGS84 datums means another error source, less that 30 meters.
GIS integration of the map system
According to the above described data, the integration of the map sheets of the second survey to a GIS and the reprojection of the into a modern, eg. the UTM, S-JTSK/Krovák or Hungarian EOV grid system, can be taken by the following steps:
· Defining Zach-Oriani ellipsoid in the used GIS software.
· Defining the Buda-1821 datum of this ellipsoid in the GIS software.
· Defining a Cassini projection in the software, interpreted on the Zach-Oriani ellipsoid with the coordinates of the Vienese Stephansdom as projection center, and eg. zeroes as False Eastings and False Nortings values of this point.
The above 3 steps have to be done only once, the following ones are necessary for each section.
· Determination of the Cassini coordinates of the upper-right (NE) corner from the row (Sectio: S ) and column (Colonne: C) numbers of the sheet by the following method:
X (Easting) = (C–20,5) * 18206.2 meters;
Y (Northing) = (44,5–S) * 12137.5 meters.
· Rotation of the scanned map content (and the perhaps necessary distortion from parallelogram to rectangle) by an image processing software to make the upper and right framelines parallel with the pixel rows and columns.
· Defining the upper-right (NE) corner of the sheet as ground control point, using its pixel coordinates and the above calculated Cassini grid coordinates
· Setting the pixel size in meters, using the scan resolution and the map scale data. Eg. in case of s 150 dpi scan and S=1:28800 map, the pixel size will be:
Pixel size = 0.0254*28800/150 = 4.8768 meters.
Note that the (re)distortion procedure above may slightly influence the pixel size.
· Reprojection of the sheet to the desired grid system (map projection).
It is easier to fit the S=1:144000 detailed map sheets; in this case, all the four map frame corners can be defined as GCPs.
The fitting of the S=1:28800 detailed sheets is burdened with significant error, which has the following components:
· The ambiguity in the old basepoint data, the error of the datum shift parameters and the omitting of the different orientation of the old and modern geodetic systems.
· The non-standard equalization of the old triangulation net.
· The differences between the old surveying and mapping and the standard Cassini projection.
· The size deformation and distortion of the paper material of the maps caused by the drying up; the distortions caused by the (multiple) copying.
As a result of the above error sources, the cumulative error of the fitting of a sheet can reach even 200 meters. Therefore, it is advisable to make a (rotationless) shift of the map content using only one sure ground control point. According to the experience, the errors are smaller at the flatland area and greater in the hills and mountains.
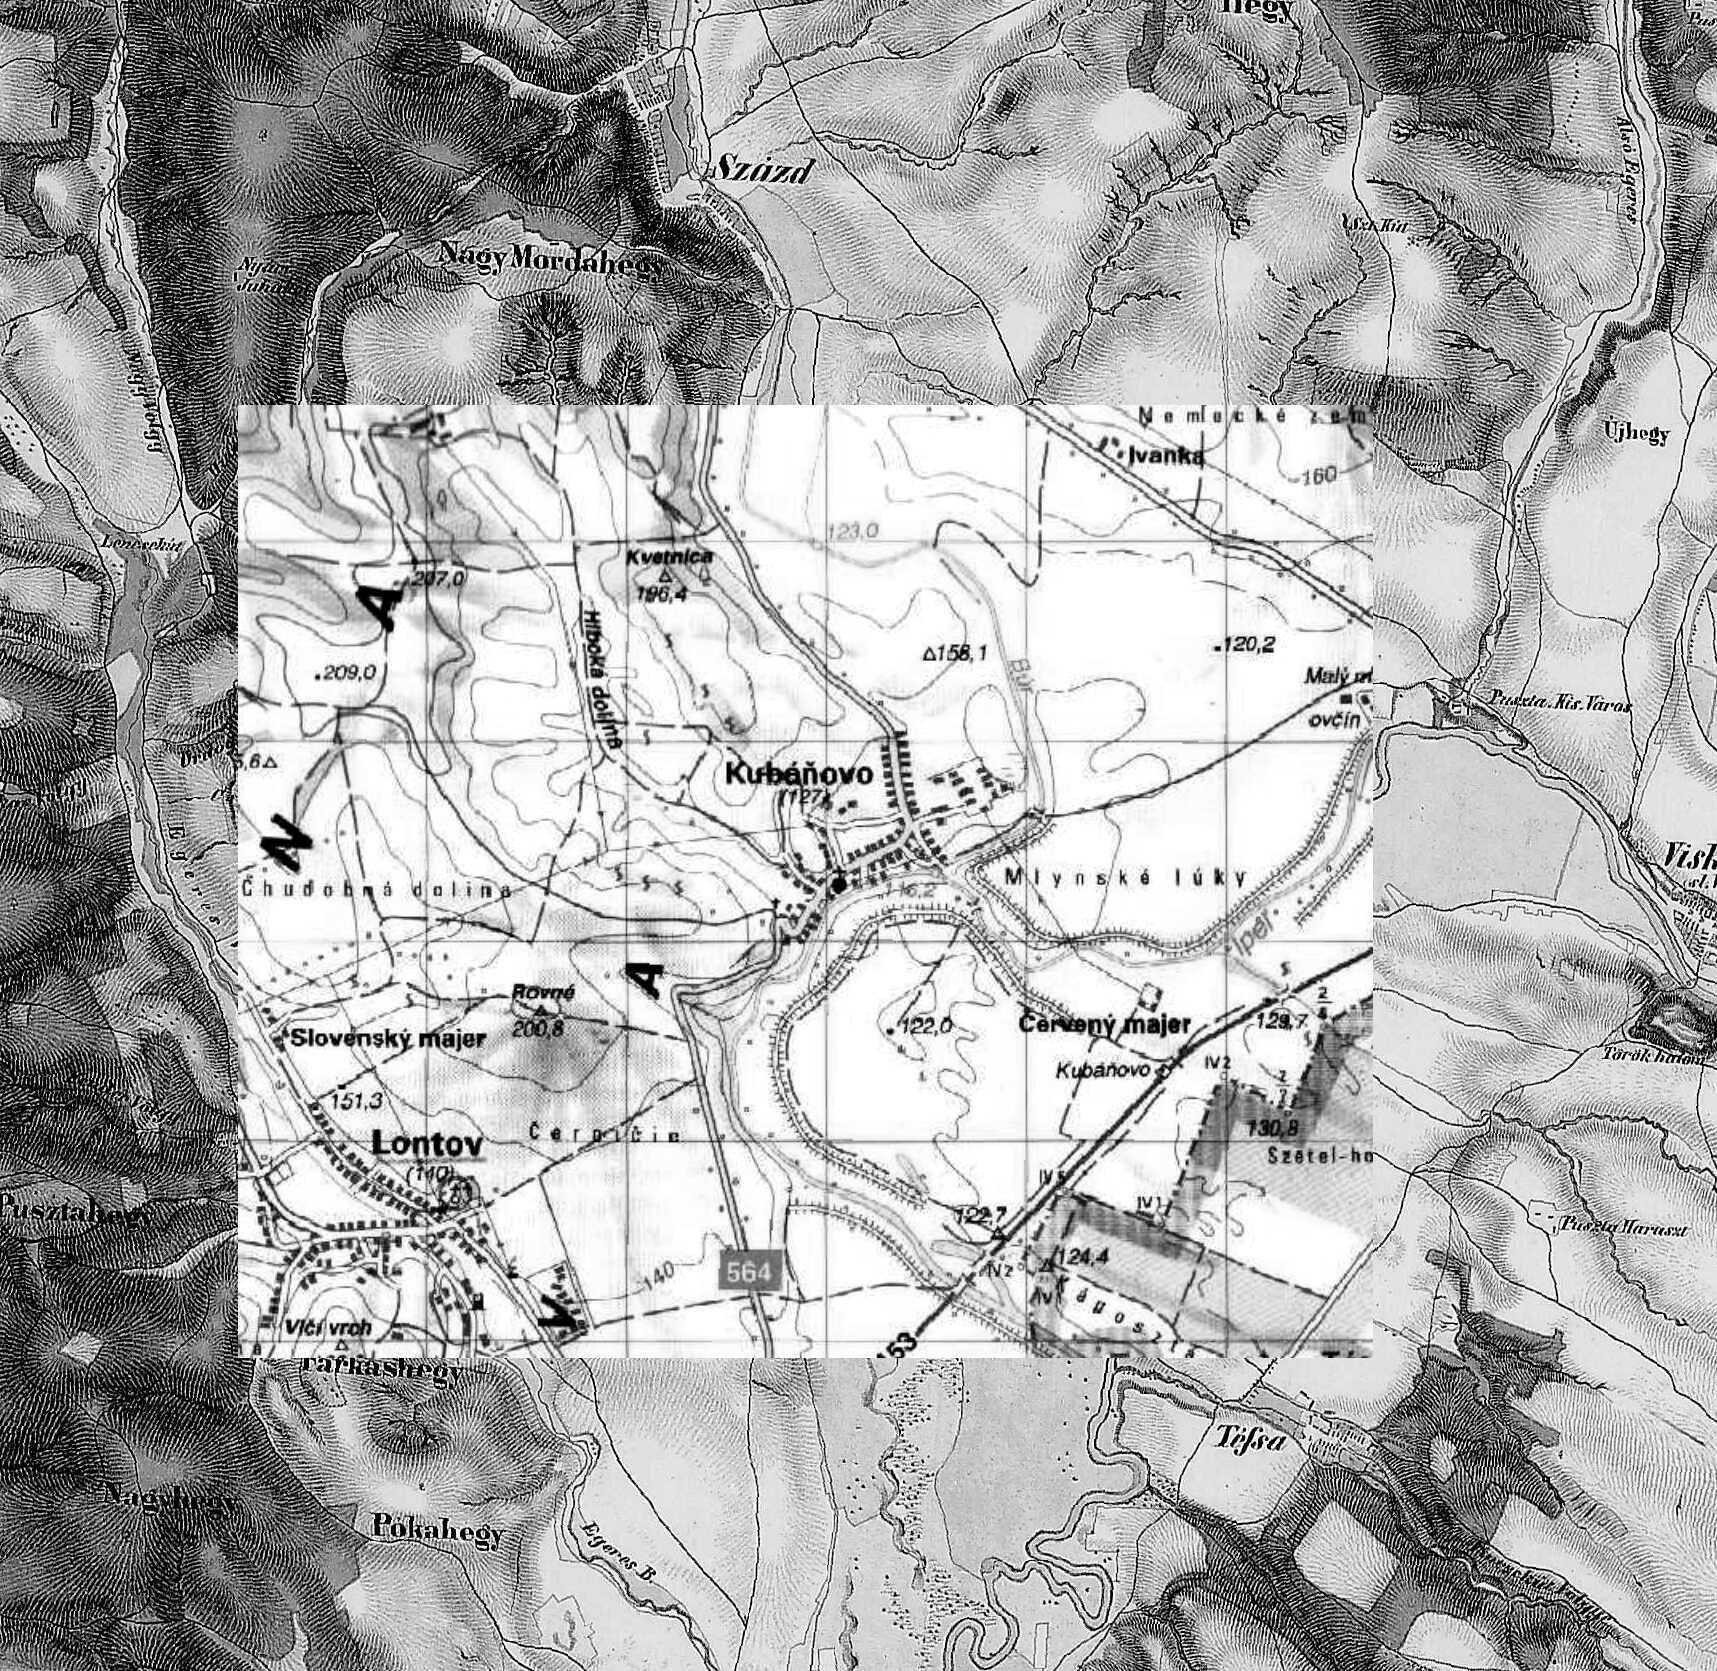
Fig. 2 Fitting of a second survey sheet and a modern touristic map (Burda, Ipeľska Pahorkatina) of VKÚ
Obr. 2 Lícovanie mapového listu 2. vojenského mapovania a súčasnej turistickej mapy (Burda, Ipeľska Pahorkatina) z VKÚ
Acknowledgements
The author is grateful for the support of the Hungarian Ministry of Informatics and Telecommunication and the Hungarian Space Office for their support (TP094) of this study. Gábor Molnár (ELTE, Budapest) and József Varga (BME, Budapest) are thanked for their consultation and help.
References
BOD, E. (1982): A magyar asztrogeodézia rövid története 1730-tól napjainkig, I. rész. Geodézia és Kartográfia 34: 283-289.
HOFSTÄTTER, E. (1989): Beiträge zur Geschichte der österreichischen Landesaufnahmen, I. Teil, Bundesamt für Eich- und Vermessungwesen, Wien, 196 p.
HOMORÓDI, L. (1953): Régi háromszögelési hálózataink elhelyezése és tájékozása. Földméréstani Közlemények 5: 1-18.
JANKÓ, A. (2001): A második katonai felmérés. Hadtörténeti Közlemények 114: 103-129.
KLEIN, B. (2001): Prvé vojenské (Jozefské) mapovanie Slovenska. In: Historické mapy. Kartografická spoločnost’ SR a Slovenský národný archív, Bratislava, 43-45 p.
MAREK, J. (1875): Technische Anleitung zur Ausführung der trigonometrischen Operationen des Katasters, Budapest.
MIKLOŠÍK, F. (1997): Prvé vojenské mapy a mapová díla územi Slovenské republiky. In: Historické mapy. Kartografická spoločnost’ SR a Slovenský národný archív, Bratislava, 160-173 p.
MUGNIER, C., J. (1999): Grids & Datums – Republic of Hungary. Photogrammetric Engineering & Remote Sensing 65: 423 & p. 425.
NIMA, National Imagery and Mapping Agency, National Aeronautics and Space Administration GSFC (1997): WGS84 EGM96 (complete to degree and order 360) 1st Edition. NIMA-NASA GSFC, St. Louis, Missouri, USA.
STRENK, T. (1985): The structure of maps covering Hungary from the first military topographic survey. Ann. Univ. Sci. Bud. de Roland Eötvös Nom. Sect. Geophys. et Meteor., Tom. I-II: 360-372.
STRENK, T. (1992): A II. katonai felvételek. In: Joó, I., Raum, F. (eds): A magyar földmérés és térképészet története, I. kötet, Budapest, 240-246 p.
TIMÁR, G., MOLNÁR, G. (2003): A második katonai felmérés térképeinek közelítő vetületi és alapfelületi leírása a térinformatikai alkalmazások számára. Geodézia és Kartográfia 55(5): 27-31.
VARGA, J. (2002): A vetületnélküli rendszerektől az UTM-ig. Electronic publication on the World Wide Web. (URL: http://www.agt.bme.hu/staff_h/varga/Osszes/Dok3uj.htm)
VEVERKA, B., ČECHUROVÁ, M. (2003): Georeferencování map II. a III. vojenského mapování. Kartografické listy 11: 103-113.
Resumé
Georeferencovanie máp II. vojenského mapovania na území Slovenska a Maďarska
Druhé vojenské mapovánie v Habsburgskej monarchii (cisarstve) sa uskutočnilo na území Maďarska v rokoch 1806 až 1869. Podrobné mapové listy (Specialkarte - špeciálne mapy) v mierke 1:144000 a topografické mapové listy v mierke 1:28800 sú vhodnou dostupnou pomôckou na výskum prírodného a urbanizoavaného prostredia 19. storočia. Mapy nemajú sieť a topografické mapy nemajú ani žiadnu indikáciu súradníc. Špeciálné mapy obsahujú hodnoty geodetickej širky a dlžky (od nultého poludníka Ferro). Vie sa, že pré územie Maďarska bol stred zobraznia (počiatok súradnicového systému) zvolený na Svätoštefanskom dome vo Viedni, ktorý je označený na liste podrobnej mapy „C5” a topografickom liste s označením „Section 44 Colonne XXI” a tiež rozsah územia zobrazeného na podrobnom liste je 54618.6 m * 36412.5 m (topografický list má rozsah: 18206.2 m * 12137.5 m) a súradnice rohov mapového listu sa dajú získajú jednoduchým násobením (sú celočíselnými násobkami čísla vrstvy - sekcie a stĺpca).
Pre geodetické a terénne merania bol (podľa Veverka a Čechurova 2003) použitý zloženy „Zachov-orianiho” elipsoid s veľkou poloosou Zachovo elipsoida (a=6376130 m) a hodnotou sploštenia Orianiho elipsoidu (f=1/310). Zobrazenie mapového súradnicového systému môže byť aproximované Cassiniho zobrazením s počiatkom na dóme Sv. Štefana (Φ=48°12’32.75”; ΛF=34°02’21.6” od Ferro; resp. ΛG=16°22’35.6” od Greenwichu). Zakladný bod súradnicového systému tvorí od roku 1821 východná veža hvezdárne Gellérthegy, ktorý preto navrhujeme označovať ako „Buda-1821” (Mugnier, 1999, označovaný ako „Vienna-1806”). Aproximované parameter prevodu z Buda-1821 do WGS84 sú: dX≈+1764 m; dY≈+283 m; dZ≈+569 m. Treba poznamenať, že tento system nie je rovnocenný štandardnej metóde, miestne súradnice počiatku sú subjektom diskusie historikov, že tieto čisla sú zaťažené chybou minimálne 30 metrov. Okrem toho, pretože zobrazenie nie je úplne Cassiniho zobrazenim, aproximované zobrazenie spôsobuje chybou viac než 200 metrov.
V praxi treba viedeť, že ľavé a horné rohy topografických listov sú deformované v dôsledku ich skladania. Možný postup prevodu môže byť založený z týchto krokov:
1. nastavenie zobrazenie a súboru parametrov (datum) v GIS,
2. stanovenie Cassiniho súradníc v pravom hornom (NE) rohu na základe čisiel vrstvy a stĺpca označenia listu,
3. rotovanie obsahu skenovanej mapy do polohy, kde horný a pravý roh sú rovnobežne s pixlami riadkov a stĺpcov,
4. označiť NE roh jeho súradnicami a nastaviť presne veľkosť pixla podľa známeho rozlíšenia skenovania a známej mieky 1:28800,
5. rektifikovať mapu vybraným zobrazením,
6. posunúť horizontálne obsah mapy bez ďalšej rotácie použitím len jedného kontrolného bodu.